.png)

Migrated a credit-bound, approval-gated AI email assistant into a self-hosted Microsoft 365 architecture for a California law firm — eliminating credit exhaustion and the Slack-approval bottleneck. Built a two-stage GPT-4o pipeline (classifier + drafter) orchestrated via Power Automate, reducing operating cost to ~$160/month and enabling autonomous email triage across 6+ mailboxes.

Who are you?
Data Scientist
Intelligent with a unique attention to detail.
| Age | 27 |
|---|---|
| Residence | United Kingdom |
| Address | Wolverhampton, UK |
| buzugbeuche@gmail.com | |
| Phone | +44 78899 843283 |
-
Python 90%
-
Machine Learning 87%
-
AI Engineering 80%
-
Data Cleaning 90%
-
Tabulea 87%
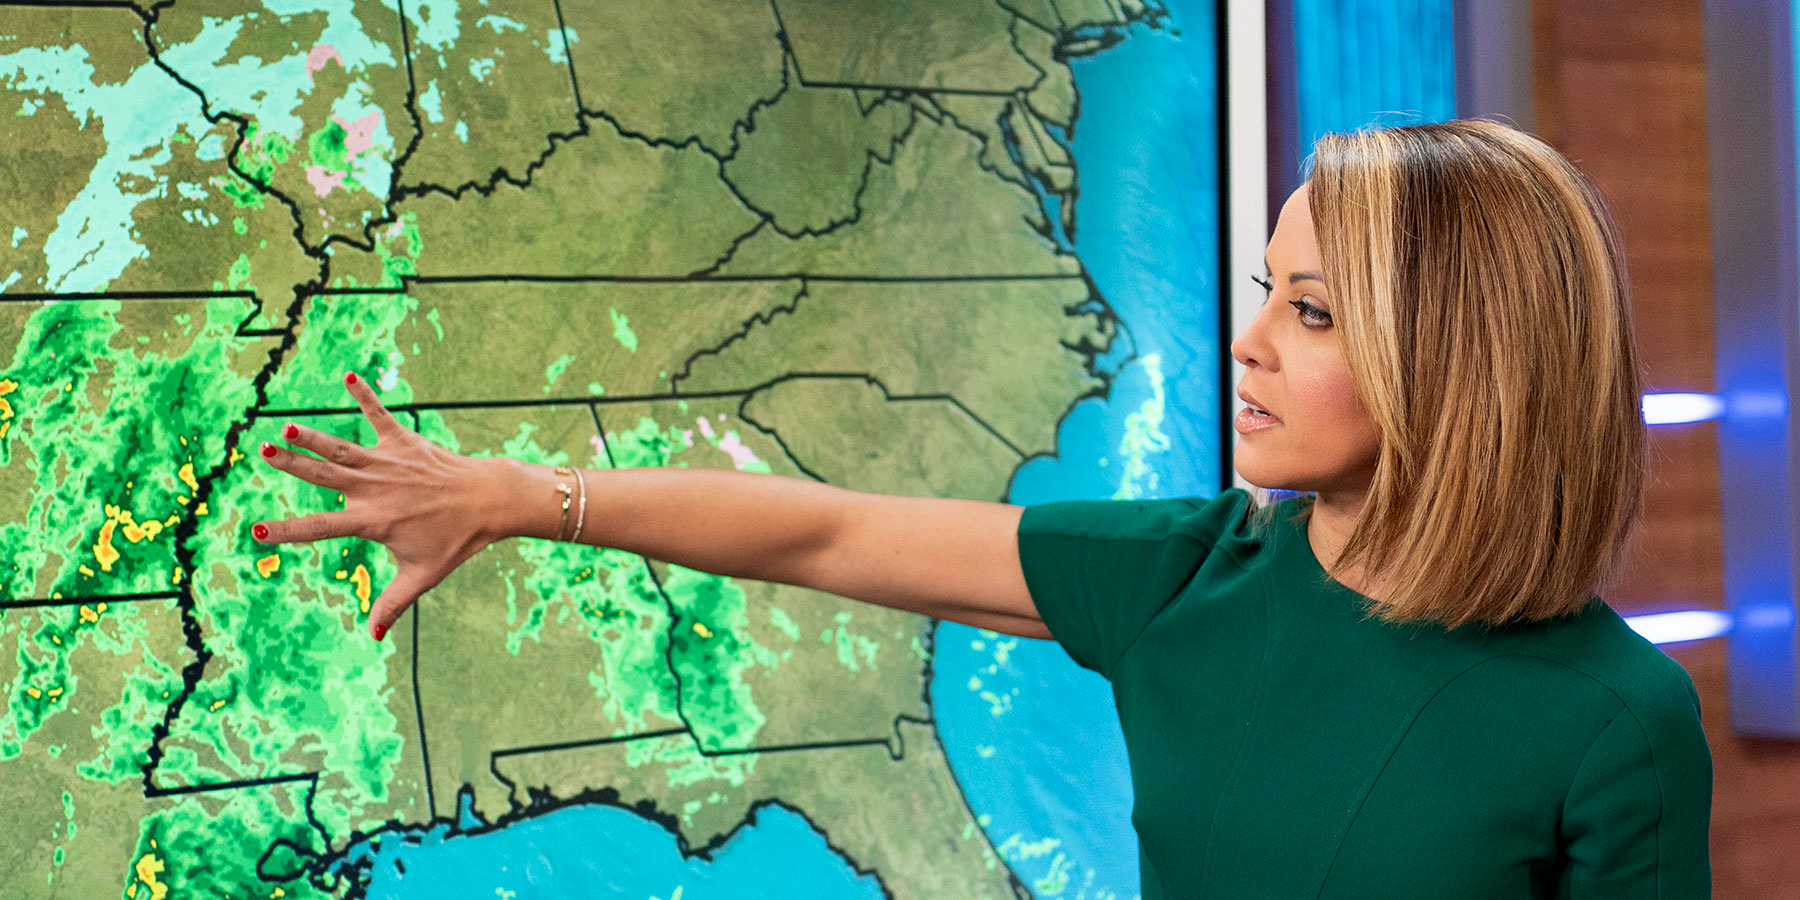
Predicting the weather using machine learning models. In this project, several models were evaluated to determine their accuracy. Each model was tested using data from a 10-day period, specifically from June 1st to June 10th, 2024. And the data is used to predict future dates. You can test it out. 77% accuracy
Developed a tool that scrapes company websites using BeautifulSoup, automatically selects relevant pages with the help of OpenAI’s reasoning capabilities, and generates professional AI-powered pitch decks in markdown format. This project demonstrates how effective data preparation and prompt engineering can produce high-quality business outputs from LLMs.

In this project, I conducted an in-depth analysis of NBA rookies using Python to explore the factors that contribute to why some players fail to last beyond their first five years in the league. By examining performance metrics, injury history, draft position, and other relevant variables, I uncovered key insights into the challenges faced by emerging talents. This analysis not only enhanced my skills in data manipulation and statistical analysis with libraries such as Pandas and NumPy but also provided a deeper understanding of the dynamics within professional basketball, helping to identify patterns that could inform scouting and player development strategies.

Built a personalized movie recommendation system that uses Cosine Similarity to generate suggestions. Added an AI explainer layer using OpenAI’s API to provide natural language explanations for each recommendation (gpt-4o-mini or Deep seek), making the system more interactive and human-like. Deployed using Hugging Face Spaces with a Gradio interface.

In this project, I conducted a comprehensive exploration of the UK 2021 Census data using R. My analysis focused on understanding the relationship between income and gender across various demographics. By employing statistical techniques and data visualization, I revealed significant insights into income disparities, highlighting trends and patterns within different regions and age groups. This project not only enhanced my skills in data wrangling and visualization with packages like ggplot2 and dplyr but also deepened my understanding of socio-economic factors influencing gender income differences. Through this analysis, I aimed to contribute to discussions on gender equity and inform policy recommendations for addressing income inequality.

In this project, I utilized Tableau to create interactive visualizations of Netflix’s TV shows and movies, focusing on the most-watched films. By analyzing viewer statistics, genres, and ratings, I uncovered trends in audience preferences and viewing habits. The visualizations highlight the popularity of different genres and viewing patterns over time. This project enhanced my Tableau skills and demonstrated the power of visual storytelling in understanding audience engagement, providing insights for content strategy in the streaming industry.

In this project, I developed an AI-powered assistant called Study Buddy to help students efficiently review academic materials using Retrieval-Augmented Generation (RAG). The tool integrates with Google Drive, allowing users to upload and access documents like PDFs and Google Docs. I built a pipeline that extracts relevant content from these files and uses OpenAI’s GPT-4o-mini to generate answers based on user queries. Through this project, I improved my skills in API integration, document parsing, and prompt engineering while gaining hands-on experience with tools like googleapiclient, PyPDF2, and Gradio. By targeting real challenges faced by students, especially in exam preparation, this work aims to bridge the gap between large volumes of study material and concise, contextual understanding.

In this project, I used Tableau to visualize a house pricing dataset, analyzing variables such as square footage, number of floors, and property grades. The visualizations reveal trends in housing prices over time, highlighting how various factors influence market fluctuations. This project sharpened my Tableau skills and illustrated the importance of data visualization in understanding real estate dynamics, offering valuable insights for potential buyers and investors.
Personal Info
Contact Me
I am always willing and happy to help your company reach its goals with my skills. Email: buzugbeuche@gmail.com, Phone number: +44 789 984 3283
Frequently Asked Questions
I have about 7 years experienece in technical
writing and 3 year experience as a Data Analyst.
In order to profer maximum satisfaction of my
clients. I try to take on one job at a time,
depending on the duration. I also take multiple jobs
depending on the complexity of the jobs.
Yes, at the moment, I can be able to handle your
projects with efficiency.